Locate every buried utility before you break ground.
Beneath every street lies a dense network of water mains, gas pipes, sewers, power and telecom cables — most poorly documented or decades out of date. Striking one means safety hazards, outages and costly delays. GPR maps both metallic and non-metallic utilities, non-destructively, across large areas in a single pass.
How GPR Insights can help
- Positioning correction — visualise the recorded GNSS trajectory on a map and manually edit individual points, multiple points or whole survey lines.
- GPS antenna offset — set X / Y / Z distances between the GPS and GPR antennas so utility responses align correctly even on zig-zag surveys.
- Best imaging quality — uses the highest-standard algorithms for slice imaging to clearly see utilities in the slice data
- Processing recipe — automatic processing and slice generation right at project creation. Learning complex processing and slicing not required.
- Tags & polylines — point-pick the apex of each hyperbola for georeferenced utility locations, or sketch the utility line across multiple B-scans and slices.
- T-scan interpretation — for multichannel scans parallel to a utility, mark the top of the pipe on the T-scan where it appears as a hyperbola.
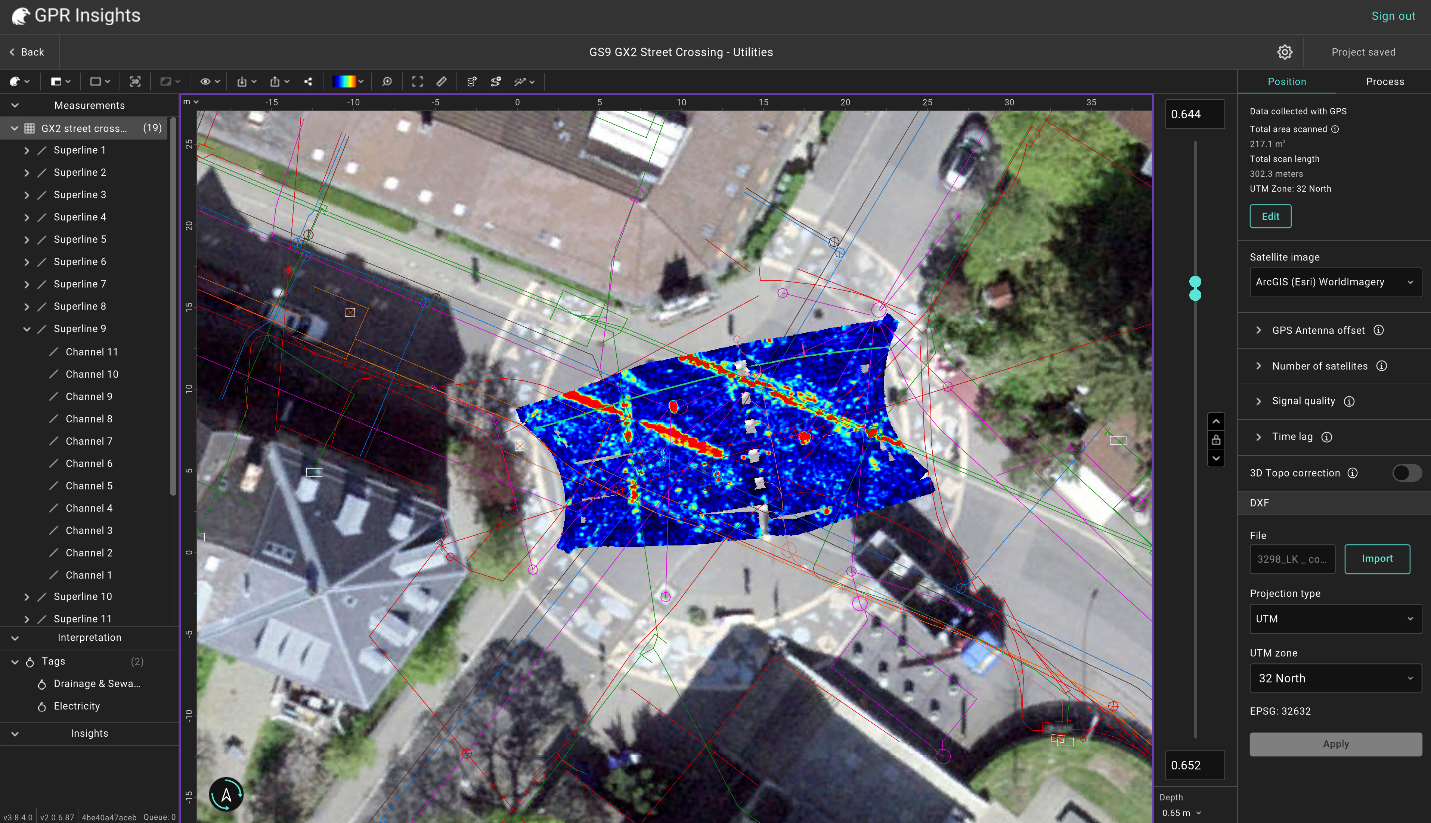
- DXF as-built overlays — import existing CAD drawings and compare them against the GPR data in the same view.
- Exports — 2D / 3D DXF (with diameter + altitude), SHP for GIS, KML for Google Earth, georeferenced GeoTIFF slices and more.
- Georeferenced utility mapEvery detected pipe, cable and conduit pinned to its real-world coordinates and displayed on a satellite basemap.
- Marking toolsTags at the apex of each hyperbola with depth, amplitude attached or object drawing of the shape of a pipe.
- 2D & 3D DXFExport to CAD with diameter and altitude labels — flexible layout for your contractor.
- SHP, KML, GeoTIFFGIS-ready outputs for QGIS, ArcGIS or Google Earth.
Map pavement layers with ease.
GPR is used in pavement assessment for determining the stratigraphy of the road structure: number of layers, layer thicknesses, delamintion water ingressor other anomalies. Vehicle-mounted multichannel GPR (such as the GM8000 GPR systems) lets teams scan at highway speed without road closures. Along with continuous GPR data, core/boreholes samples are also taken as ground truth to compare the GPR data and calibrate.
How GPR Insights can help
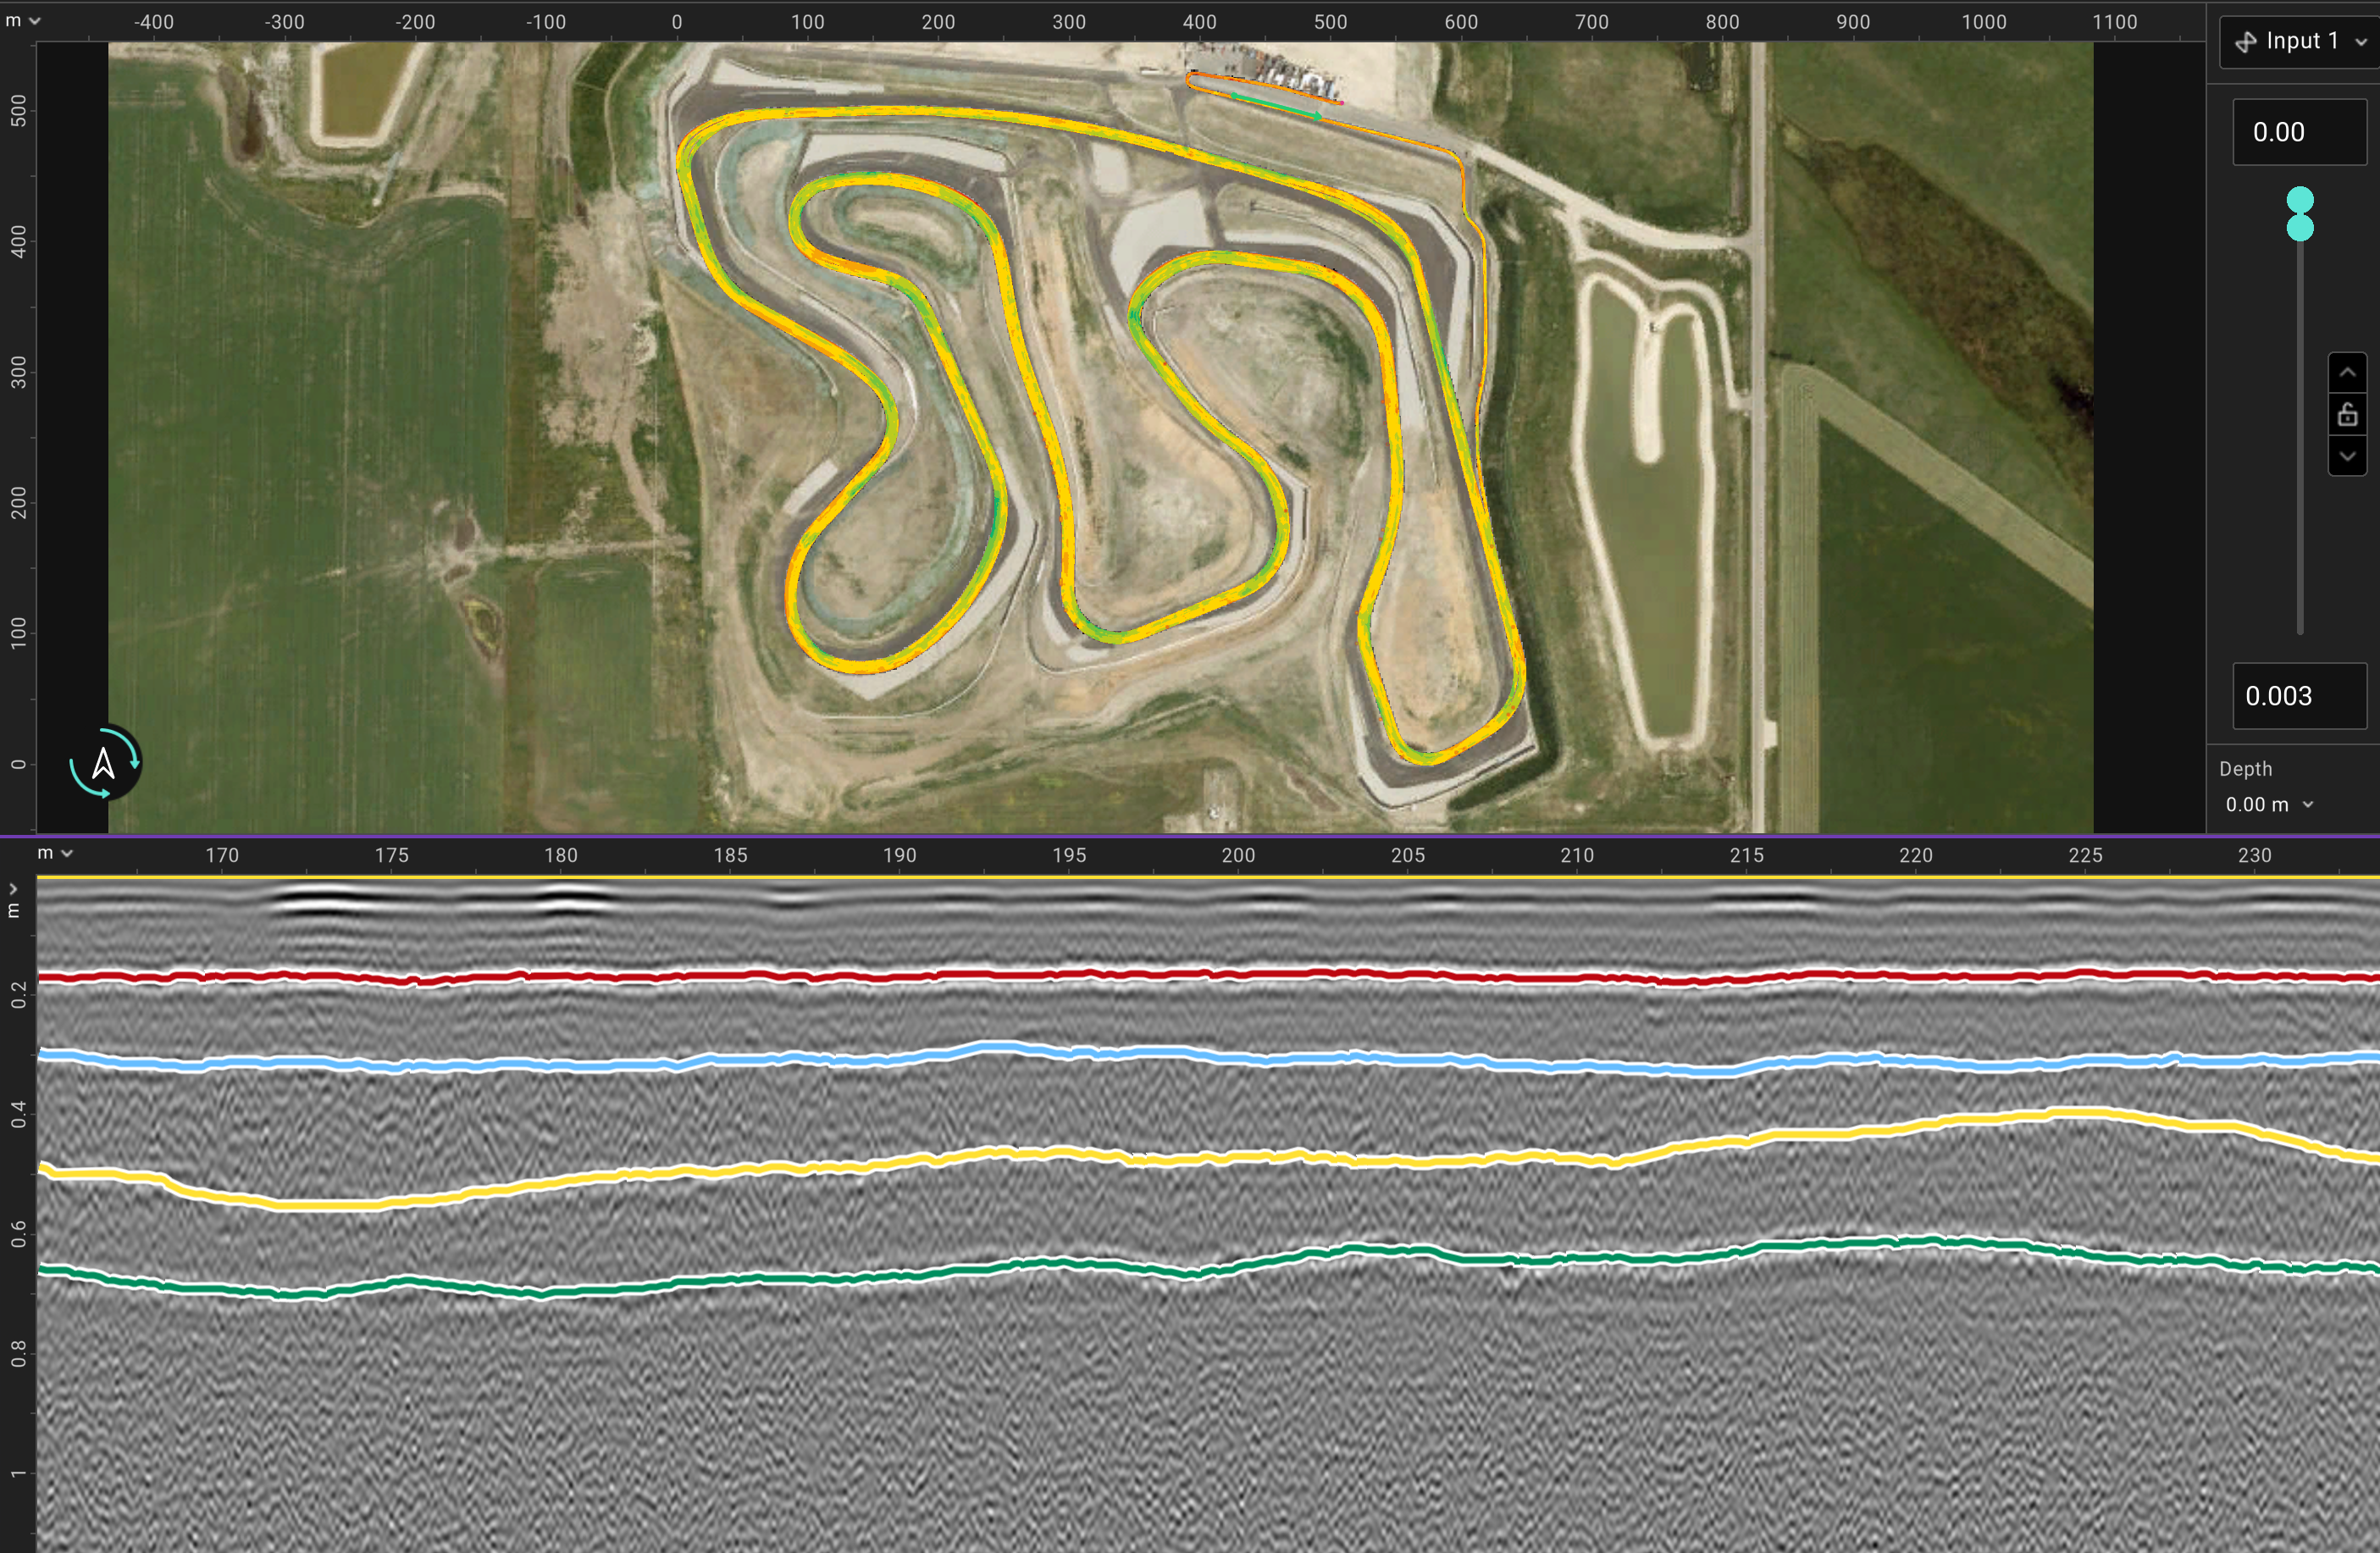
- Horizon mapping — automatically trace positive or negative peak amplitudes across a B-scan, multiple B-scans, or the full survey to map a layer interface.
- Multi-horizon support — map several interfaces simultaneously, each with its own colour, then read off layer thickness as the depth difference between horizons.
- Smoothing & manual editing — apply smoothing for noisy horizons or manually fix individual segments.
- Three horizon heatmaps — Depth (depth of interface from surface), Thickness (between two horizons), and Amplitude (delamination & moisture indicator).
- Core integration — import cores with diameter, layer count and thicknesses; place them directly on the B-scan to calibrate dielectric and validate horizons.
- 3D core view — visualise cores with 3D horizon surfaces in 3D.
- Processing recipe — automatic processing and slice generation right at project creation. Learning complex processing and slicing not required.
- Depth & thickness heatmapInterface depth variation and map of asphalt, base or other layer thickness across the entire surveyed road. Useful for identifying areas where depth/thickness do not follow minimum requirements.
- Amplitude mapsAmplitude heatmaps that can assisting in flagging delamination or high-moisture zones.
- Multi-horizon B-scansSeveral interfaces traced with distinct colours, ready for the technical report.
- Core-calibrated dielectric & depthsImported core records to calibrate the GPR velocity to ground truth and acquire accurate thickness numbers.
From thousands of B-scans to a publishable condition map.
Bridge decks resist traffic loading, weather, moisture, de-icing salts and surface wear and with time quietly accumulate cracking, corrosion, delamination and spalling. GPR can assist in capturing the subsurface state across the whole deck at once, especially with multichannel systems with very small channel spacing such as the GS9000 GX1 or the vehicle mounted GM8000 GX1 system that scan dense grids in a single pass making it easier and faster to map the reinforcement layer across the deck.
How GPR Insights can help
- AI rebar detection — automatically locates rebar hyperbolas across the full survey. Confidence slider + depth range are used to optimize and limit the picks to the first rebar layer.
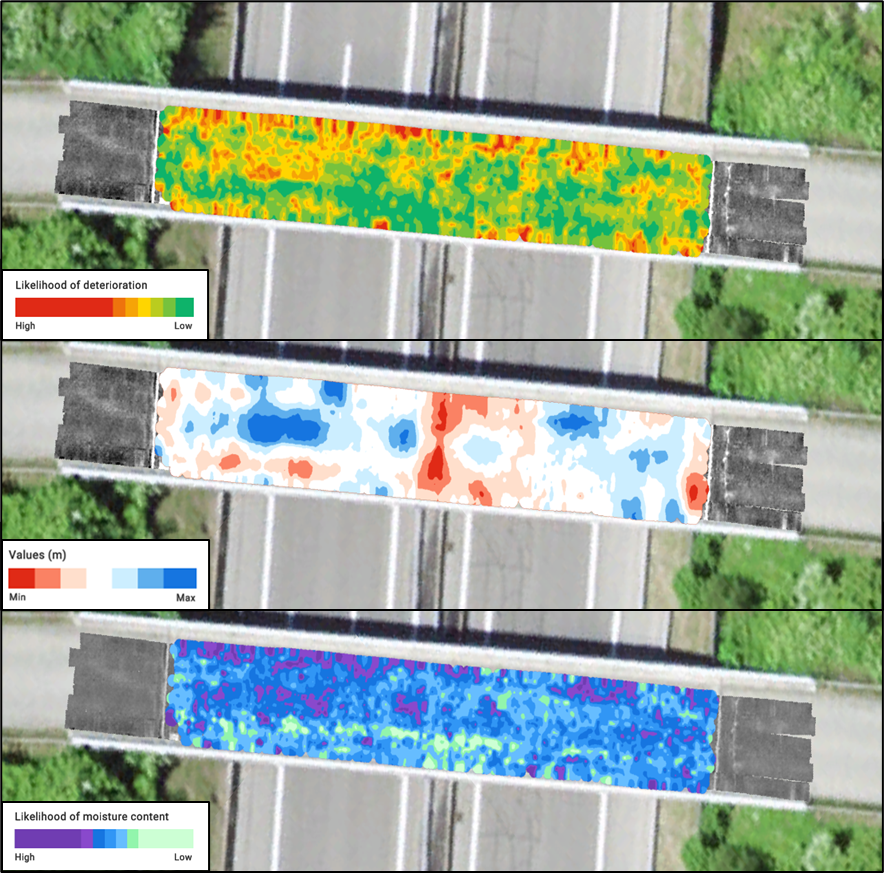
- Deterioration map (ASTM D6087) — amplitude heatmap of the top rebar layer following the process as described in the ASTM D6087 standard.
- Moisture map — local dielectric / velocity value estimated per rebar and plotted across the deck to indicate areas of higher moisture.
- Cover map — concrete cover thickness per detected rebar. Subtract asphalt overlay where present to get cover.
- A/C interface mapping — auto-trace the asphalt / concrete interface across every channel and line to produce an asphalt thickness heatmap.
- Crack detection — with dense 2.5 cm channel spacing (GX1), 1-sample thin slices on the shallow part of the deck reveal individual surface cracks. Insights high-quality slicing with proper visualization allows to detect these cracks.
- ASTM D6087 deterioration mapLikelihood of deterioration heatmap at or above the top rebar layer based on standard for asphalt-covered bridge deccks.
- Moisture & cover mapsPer rebar dielectric and cover thickness distributions across the full deck.
- A/C interface thicknessAutomatic asphalt thickness heatmap from the auto-traced A/C interface.
Find rebars, ducts, backwall and other objects before you drill.
For reinforced concrete in walls, floor slabs and columns scanned with small high-frequency probes like the GP8800 or GP8000. Drilling through elements is expensive thus every reinforcing element and objects need to be detected, marked and exported as an annotated plan your contractor can drill against with confidence.
How GPR Insights can help
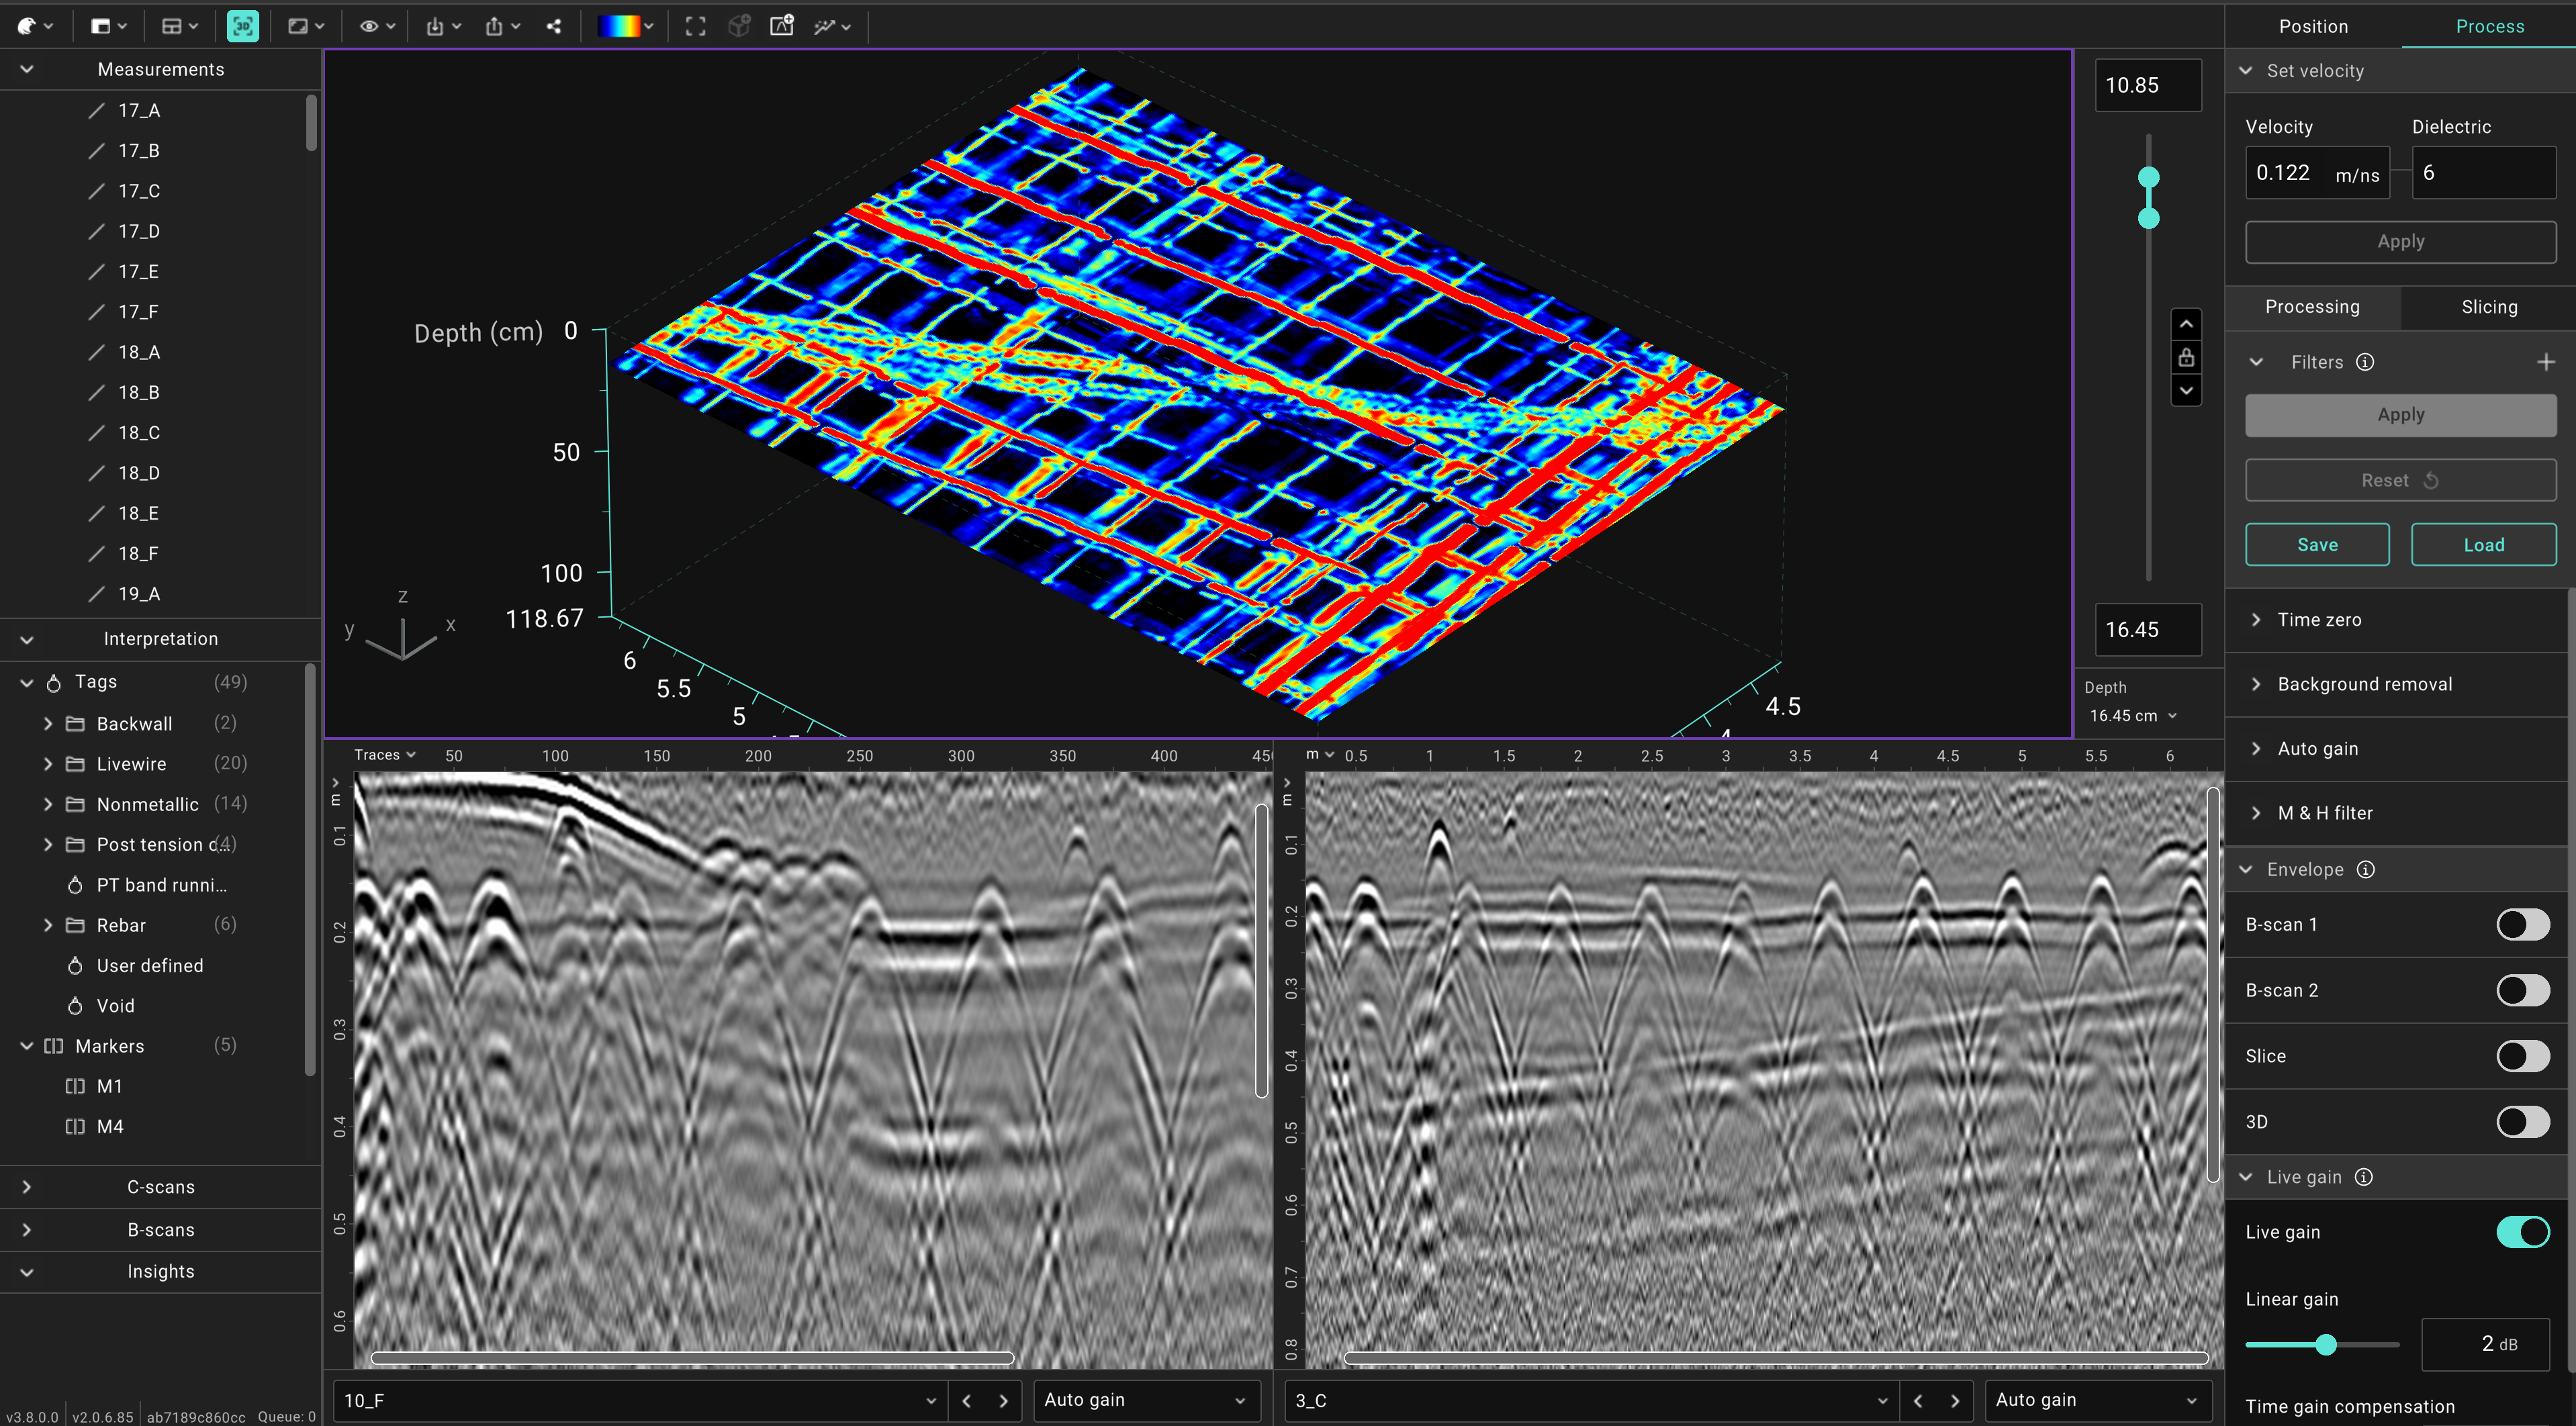
- Standard processing recipe — Time-zero → Background removal → Gain → Migration → Hilbert. The M&H combo collapses hyperbolas to point reflections at their true location.
All optimized per probe and applied automatically at project creation. - AI rebar detection — Same auto-picking model as bridge-deck inspection for detecting rebars, applied to the first rebar layer.
- Three condition maps — Generate Cover, Moisture and Condition maps together. Compare them to avoid misinterpetation (e.g. area with deeper rebars as deteriorated).
- Tags & objects — Point pick rebars, PT ducts, backwalls and conduits or sketch their shape and direction with polylines.
- DXF export — Export marked interpretation items as 2D or 3D DXF.
- Drillable rebar layoutTagged rebars, PT ducts and conduits, all exportable as an annotated 2D/3D DXF plan for the contractor.
- Three condition mapsCover, Moisture and Condition maps generated together for interpretation.
- Clean reinforcement slicesHigh-quality slices allowing for clear object visualization and detection.